The figure given below depicts the equilibrium exchange rate between the U.S dollar and the Mexican peso.?Figure 13.2
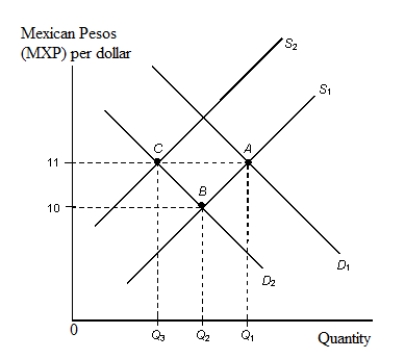
-Refer to Figure 13.2. When the Mexican demand for U.S. dollars rises from D₂ to D₁ and the relevant supply curve is S₁:
A) the U.S. dollar depreciates in value relative to the peso.
B) the Mexican peso depreciates in value relative to the U.S. dollar.
C) the Mexican peso appreciates in value relative to the U.S. dollar
D) U.S. imports from Mexico decreases.
E) Mexican net exports to the United States becomes positive.
Correct Answer:
Verified
Q61: In foreign exchange markets, a U.S.resident who
Q64: Assume that the yen price of one
Q67: The figure given below depicts the equilibrium
Q69: To keep the U.S.dollar from depreciating against
Q72: The supply of the U.S.dollar on the
Q74: The figure given below depicts the equilibrium
Q75: The supply curve of U.S.dollars in the
Q76: The figure given below depicts the equilibrium
Q77: If the U.S.dollar depreciates against the yen
Q78: To fix the foreign currency price of
Unlock this Answer For Free Now!
View this answer and more for free by performing one of the following actions

Scan the QR code to install the App and get 2 free unlocks

Unlock quizzes for free by uploading documents