The figure given below represents the short run and long run Phillips curve.
Figure 14.4
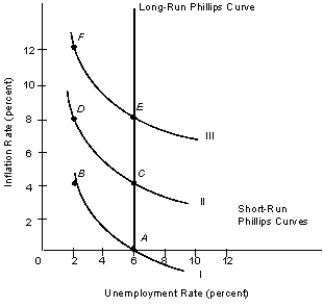
-Refer to Figure 14.4. If the adaptive expectations hypothesis holds, and the economy moves from point C to point D because of expansionary fiscal policy, what rate of inflation are people expecting at point D?
A) 2 percent
B) 4 percent
C) 6 percent
D) 8 percent
E) 10 percent
Correct Answer:
Verified
Q3: The key feature due to which unexpected
Q23: When aggregate demand declines unexpectedly and wage
Q27: According to the rational expectations view:
A)the economy
Q42: The figure given below represents the short
Q44: During the 1970s, real shocks to the
Q46: Which of the following gives the Fed
Q48: The figure given below represents the short
Q49: The figure given below represents the short
Q51: Suppose workers do not believe the Fed
Q56: Suppose that the Fed announces a low-money-growth
Unlock this Answer For Free Now!
View this answer and more for free by performing one of the following actions

Scan the QR code to install the App and get 2 free unlocks

Unlock quizzes for free by uploading documents