Exhibit 3-6 Demand and supply curves
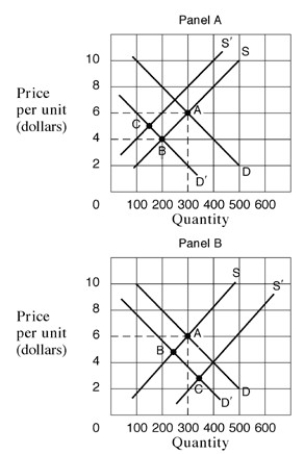
-In Exhibit 3-6,Panel A,the movement from A to B describes a/an:
A) increase in demand and an increase in the quantity supplied.
B) increase in the quantity demanded and an increase in supply.
C) decrease in demand and a decrease in the quantity supplied.
D) decrease in the quantity demanded and a decrease in supply.
E) decrease in the quantity demanded and an increase in supply.
Correct Answer:
Verified
Q84: If quantity supplied is greater than the
Q87: If the quantity demanded is less than
Q89: Exhibit 3-5 Demand and supply data for
Q90: Assume Qs represents the quantity supplied at
Q94: If the price is lower that the
Q94: Exhibit 3-4 Demand and supply curves
Q95: When the price of a good in
Q97: Exhibit 3-7 Supply and demand curves
Q242: If the market price is below the
Q266: Which of the following is true about
Unlock this Answer For Free Now!
View this answer and more for free by performing one of the following actions

Scan the QR code to install the App and get 2 free unlocks

Unlock quizzes for free by uploading documents