The income levels vary by race and educational attainment. To examine this inequality in the income, data have been collected for 7 different years on the median income earned by an individual based on the race and education.

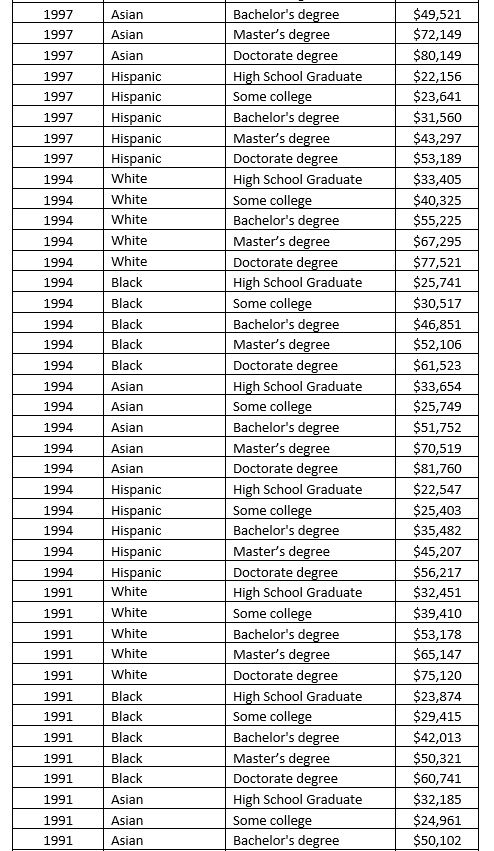
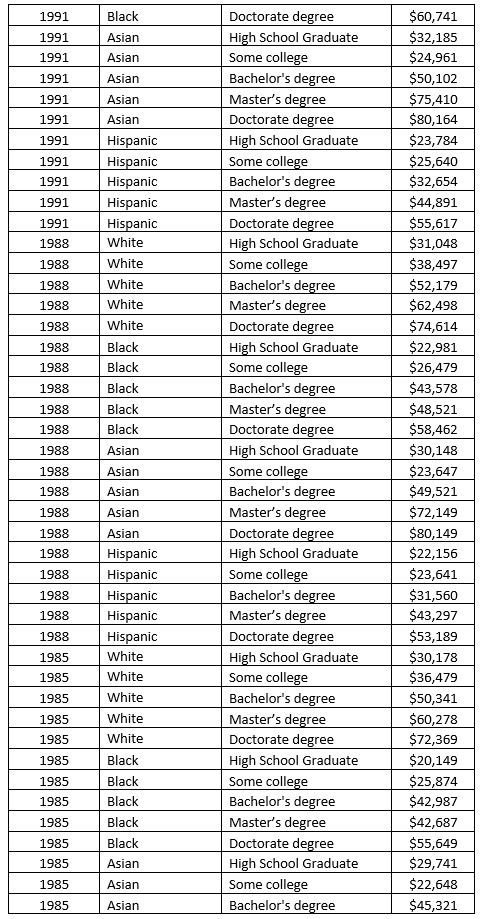
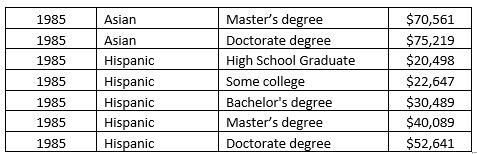
a. Sort the PivotTable data to display the years with the smallest sum of median income on top and the largest on the bottom. Which year had the smallest sum of median income? What is the total income in the year with the smallest sum of median income?
b. Add the Racial Demographic to the Row Labels in the PivotTable. Sort the Racial Demographic by Sum of Median Income with the lowest values on top and the highest values on bottom. Filter the Row Labels so that only the year 2003 is displayed. Which Racial demography had the smallest sum of median income in the year 2003? Which Racial demography had the largest sum of median income in the year 2003?
Correct Answer:
Verified
View Answer
Unlock this answer now
Get Access to more Verified Answers free of charge
Q51: The following table shows the average monthly
Q52: The data on the ranks assigned to
Q53: A research was conducted on a sample
Q54: The following table is an example on
Q55: Consider the following survey results regarding marital
Q56: The data on the runs scored in
Q58: The total number of runs scored by
Q59: The regional manager of a company wishes
Q60: A summary on commodities below lists the
Q61: The owner of the grocery store is
Unlock this Answer For Free Now!
View this answer and more for free by performing one of the following actions

Scan the QR code to install the App and get 2 free unlocks

Unlock quizzes for free by uploading documents