The total number of runs scored by the players in the previous problem is 198. The following pie chart shows the percentage of runs scored by each player:
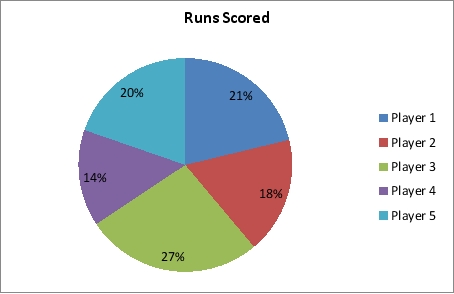
a. What are the problems with using a pie chart to display these data?
b. What type of chart would be preferred for displaying the data in this pie chart?
c. Use a different type of chart to display the percentage of runs scored by each player that conveys the data better than the pie chart. Format the chart and add data labels to improve the chart's readability.
Correct Answer:
Verified
View Answer
Unlock this answer now
Get Access to more Verified Answers free of charge
Q51: The following table shows the average monthly
Q52: The data on the ranks assigned to
Q53: A research was conducted on a sample
Q54: The following table is an example on
Q55: Consider the following survey results regarding marital
Q56: The data on the runs scored in
Q57: The income levels vary by race and
Q59: The regional manager of a company wishes
Q60: A summary on commodities below lists the
Q61: The owner of the grocery store is
Unlock this Answer For Free Now!
View this answer and more for free by performing one of the following actions

Scan the QR code to install the App and get 2 free unlocks

Unlock quizzes for free by uploading documents