As part of the quarterly reviews, the manager of a retail store analyzes the quality of customer service based on the periodic customer satisfaction ratings (on a scale of 1 to 10 with 1 = Poor and 10 = Excellent). To understand the level of service quality, which includes the waiting times of the customers in the checkout section, he collected the following data on 100 customers who visited the store.

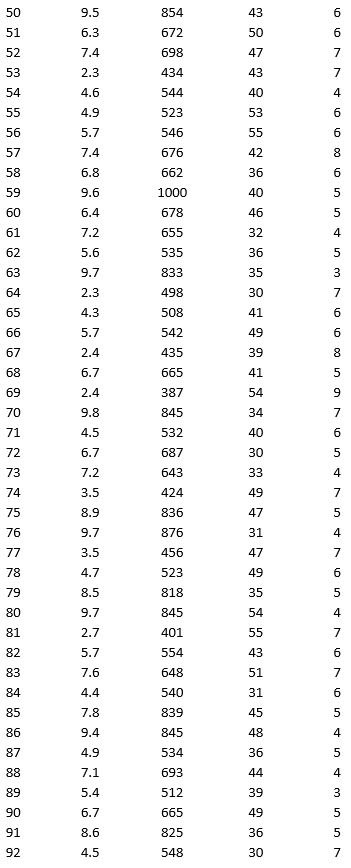
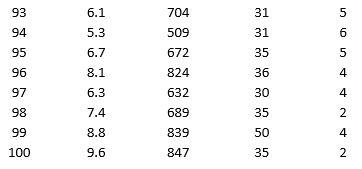
a. Apply hierarchical clustering with 5 clusters using Wait Time (min) and Customer Satisfaction Rating as variables. Be sure to Normalize input data in Step 2 of the XLMiner Hierarchical Clustering procedure, and specify single linkage as the clustering method. Analyze the resulting clusters by computing the cluster size. It may be helpful to use a PivotTable on the data in the HC_Clusters worksheet generated by XLMiner to compute descriptive measures of the Wait Time and Customer Satisfaction Rating variables in each cluster. You can also visualize the clusters by creating a scatter plot with Wait Time (min) as the x-variable and Customer Satisfaction Rating as the y-variable.
b. Repeat part a using average linkage as the clustering method. Compare the clusters to the previous method.
Correct Answer:
Verified
View Answer
Unlock this answer now
Get Access to more Verified Answers free of charge
Q44: A bank is interested in identifying different
Q45: A bank wants to understand better the
Q46: A bank wants to understand better the
Q47: To examine the local housing market in
Q48: To examine the local housing market in
Q50: To examine the local housing market in
Q51: As part of the quarterly reviews, the
Q52: To examine the local housing market in
Q53: To examine the local housing market in
Q54: To examine the local housing market in
Unlock this Answer For Free Now!
View this answer and more for free by performing one of the following actions

Scan the QR code to install the App and get 2 free unlocks

Unlock quizzes for free by uploading documents