To examine the local housing market in a particular region, a sample of 120 homes sold during a year are collected. The data is given below.

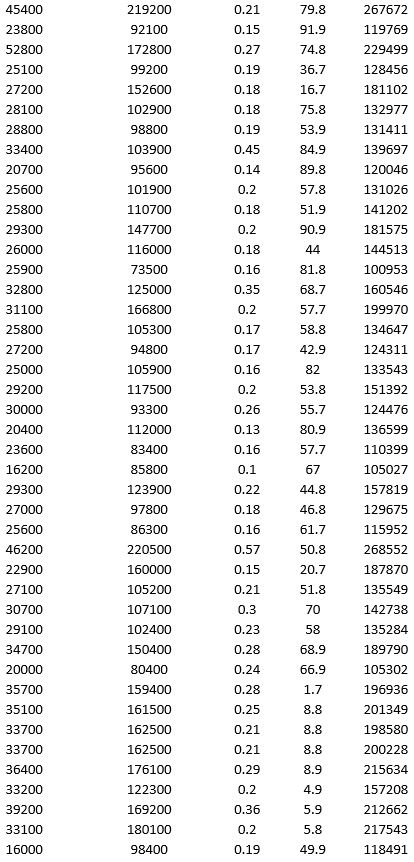
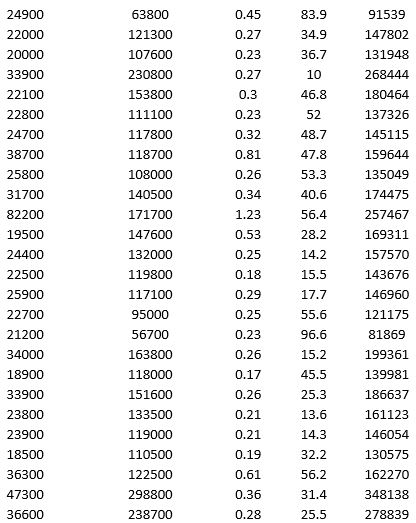
a. Apply hierarchical clustering with 10 clusters using LandValue ($), BuildingValue ($), Acres, Age, and Price ($) as variables. Be sure to Normalize input data in Step 2 of the XLMiner Hierarchical Clustering procedure, and specify complete linkage as the clustering method. Analyze the resulting clusters by computing the cluster size. It may be helpful to use a PivotTable on the data in the HC_Clusters worksheet generated by XLMiner. You can also visualize the clusters by creating a scatter plot with Acre as the x-variable and Price ($) as the y-variable.
b. Repeat part a using average group linkage as the clustering method. Compare the clusters to the previous method.
Correct Answer:
Verified
View Answer
Unlock this answer now
Get Access to more Verified Answers free of charge
Q45: A bank wants to understand better the
Q46: A bank wants to understand better the
Q47: To examine the local housing market in
Q48: To examine the local housing market in
Q49: As part of the quarterly reviews, the
Q51: As part of the quarterly reviews, the
Q52: To examine the local housing market in
Q53: To examine the local housing market in
Q54: To examine the local housing market in
Q55: A bank is interested in identifying different
Unlock this Answer For Free Now!
View this answer and more for free by performing one of the following actions

Scan the QR code to install the App and get 2 free unlocks

Unlock quizzes for free by uploading documents