In a one-factor ANCOVA, suppose the factor has two levels (groups) . Scatterplots of the dependent variable (Y) and the covariate (X) are generated (where group 1 is indicated by "•" and group 2 by "o") . Which of the following graphs shows the most desirable situation?
A) 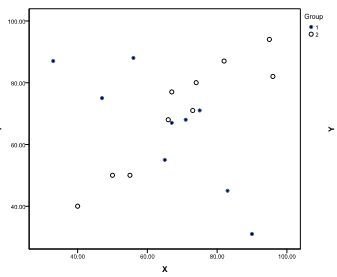
B) 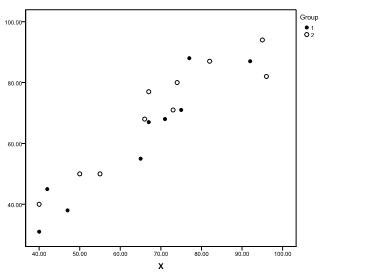
C) 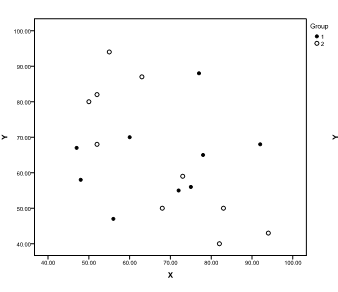
D) 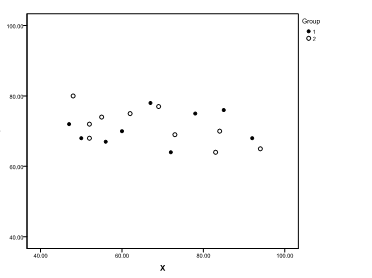
Correct Answer:
Verified
Q9: A researcher wanted to examine if soil
Q10: A researcher wanted to examine if soil
Q11: A researcher wanted to examine if soil
Q12: A researcher wanted to examine if soil
Q13: A researcher wanted to examine if soil
Q14: In ANCOVA, suppose Y is the dependent
Q16: Susan runs an ANOVA using the covariate
Q17: The covariate in ANCOVA serves as which
Q18: In ANCOVA, which of the following is
Q19: The covariate in ANCOVA is also referred
Unlock this Answer For Free Now!
View this answer and more for free by performing one of the following actions

Scan the QR code to install the App and get 2 free unlocks

Unlock quizzes for free by uploading documents