Which of the following graphs is most likely to represent the acceleration of an athlete during a 100 m sprint? 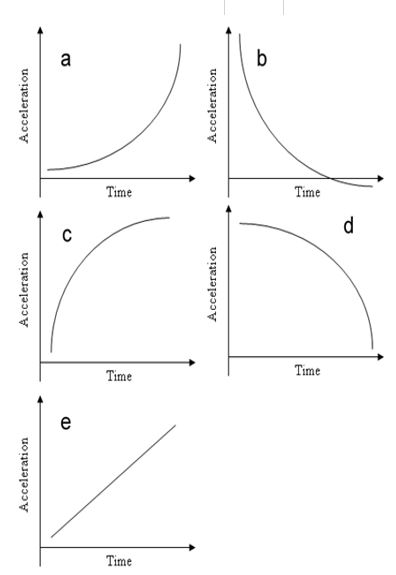
A) Image a
B) Image b
C) Image c
D) Image d
E) Image e
Correct Answer:
Verified
Q35: Resultant forces equal to two co-planar (occupying
Q36: The stability of an object can be
Q37: An athlete is holding a 5kg dumbbell
Q38: Draw a free body diagram (using the
Q39: What are the first and second conditions
Q41: The top graph in the figure below
Q42: Immediately before the body comes to rest
Q43: During which of the following phases of
Q44: The position of the head of
Q45: Figure A4.5
![]()
Unlock this Answer For Free Now!
View this answer and more for free by performing one of the following actions

Scan the QR code to install the App and get 2 free unlocks

Unlock quizzes for free by uploading documents