The top graph in the figure below shows position vs time of an athlete performing a shuttle run (i.e. forwards and backwards) . Which of the four graphs below this (a - d) is most likely to represent the athlete's velocity vs time for the same movement? 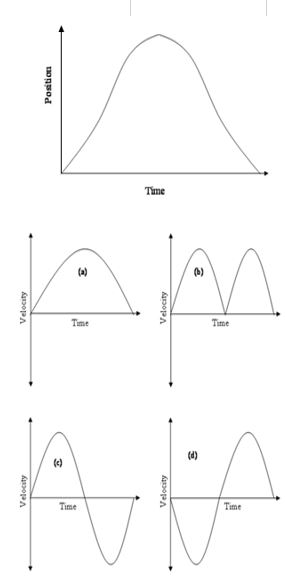
A) Image a
B) Image b
C) Image c
D) Image d
Correct Answer:
Verified
Q36: The stability of an object can be
Q37: An athlete is holding a 5kg dumbbell
Q38: Draw a free body diagram (using the
Q39: What are the first and second conditions
Q40: Which of the following graphs is most
Q42: Immediately before the body comes to rest
Q43: During which of the following phases of
Q44: The position of the head of
Q45: Figure A4.5 Q46: Figure A4.5
![]()
![]()
Unlock this Answer For Free Now!
View this answer and more for free by performing one of the following actions

Scan the QR code to install the App and get 2 free unlocks

Unlock quizzes for free by uploading documents