Which of the following graphs would be most likely to represent the relationship between velocity and the optimal angle of a projectile that is released from a higher position than it lands? 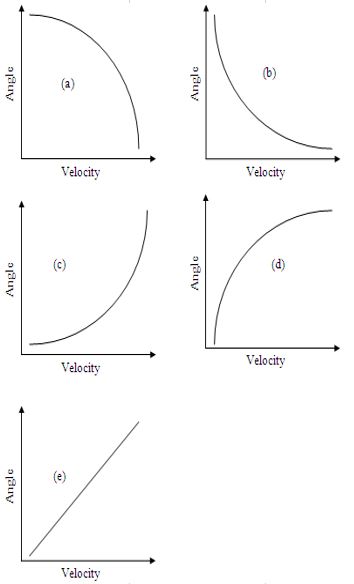
A) Image a
B) Image b
C) Image c
D) Image d
E) Image e
Correct Answer:
Verified
Q45: Figure A4.5 Q46: Figure A4.5 Q47: Figure A4.5 Q48: How far does the athlete travel at Q49: The table below contains data from the Q50: A volleyball player performs a standing vertical Q51: A sprinter has a constant acceleration of Q52: A golf ball is struck with a Q53: A pole vaulter takes 1.3 s to Q54: Which of the following graphs most closely Unlock this Answer For Free Now! View this answer and more for free by performing one of the following actions Scan the QR code to install the App and get 2 free unlocks Unlock quizzes for free by uploading documents
![]()
![]()
![]()

