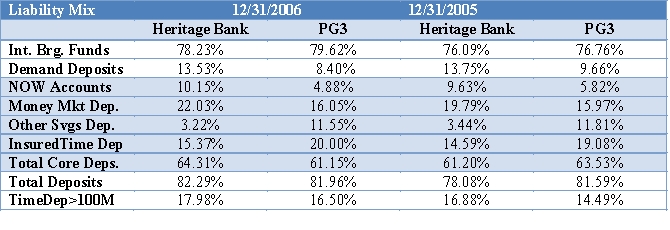
Analyze the Liability Mix and Rate Differences for Heritage Bank and the PG3 to explain differences and trends in IE%.
 Other Liabilities:
Correct Answer:
Verified
Q1: Using the information below, explain specifically why
Q2: Examine the trends in the NIM and
Q3: Do a Dupont Analysis where ROA =
Q4: Burden Analysis: Analyze the trends and compare
Q5: Net Interest Margin Analysis: Evaluate rends difference
Q7: Evaluate Heritage's capital and credit using the
Q8: Analyze the Liquidity Risk of Heritage Bank
Q9: Conclusion: Summarize Heritage's weaknesses and strengths from
Q10: If a bank has an ROA of
Q11: The Board of Directors of the 1st
Unlock this Answer For Free Now!
View this answer and more for free by performing one of the following actions

Scan the QR code to install the App and get 2 free unlocks

Unlock quizzes for free by uploading documents