What (approximate) correlation is shown in the following scatterplot: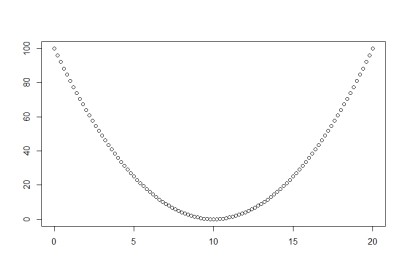
A) 0.50
B) 1.00
C) Impossible to say without the data.
D) 0.00
Correct Answer:
Verified
Q2: A researcher wants to examine the relationship
Q3: If we find a negative relationship between
Q4: A researcher finds that orchestra conductors tend
Q5: We should be concerned about possible outliers
Q6: Using Cohen's criteria, we would describe a
Q7: Using Cohen's criteria we would describe a
Q8: Which of the following sets of values
Q9: Which of the following is true:
A) If
Q10: You should use a Spearman correlation, rather
Q11: Regression analysis, rather than correlation might be
Unlock this Answer For Free Now!
View this answer and more for free by performing one of the following actions

Scan the QR code to install the App and get 2 free unlocks

Unlock quizzes for free by uploading documents