Multiple Choice
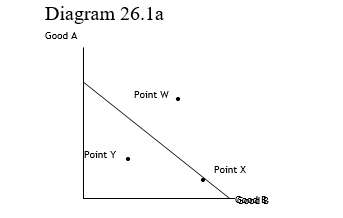
-The production possibilities curve depicted in Diagram 26.1 reflects
A) increasing opportunity costs
B) decreasing opportunity costs
C) constant opportunity costs.
D) the absence of opportunity costs.
Correct Answer:
Verified
Related Questions

