Multiple Choice
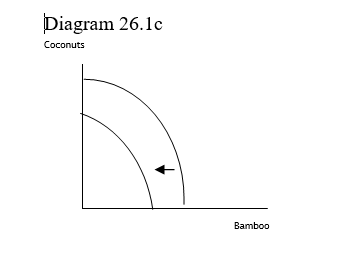
-The shift in the production possibilities curve shown in Diagram 26.1c reflects
A) an increase in resources used in the production of both goods.
B) a decrease in resources used in the production of both goods.
C) an decrease in resources used in the production of bamboo only.
D) an decrease in resources used in the production of coconuts only.
Correct Answer:
Answered by Quizplus AI
Related Questions

