Which of the following graphs correctly represents the effect on the Phillips curve in India if the Indian rupee depreciates?
A) 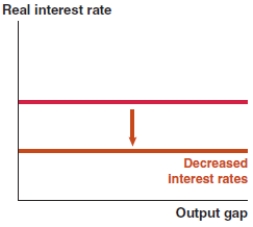
B) 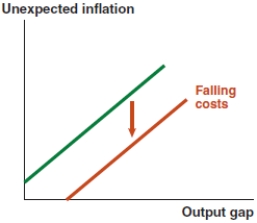
C) 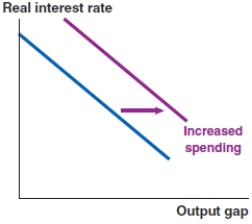
D) 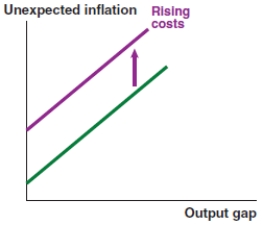
Correct Answer:
Verified
Q62: If the default risk rises in Greece,
Q63: Which of the following graphs correctly represents
Q64: Which of the following graphs correctly represents
Q65: Which of the following graphs correctly represents
Q66: Which of the following graphs correctly represents
Q68: Which of the following graphs correctly represents
Q69: In 2017, nearly 7.6% of Vietnamese imports
Q70: In 2017, nearly 3.5% of Vietnamese imports
Q71: Assume that the economy starts at a
Q72: The economy shown here begins at a
Unlock this Answer For Free Now!
View this answer and more for free by performing one of the following actions

Scan the QR code to install the App and get 2 free unlocks

Unlock quizzes for free by uploading documents