Assume that the economy starts at a 0% output gap. Now suppose that banks begin to fear the risk of default and the risk premium rises by 2%. Which of the following figures shows what happens in this scenario?
Figure A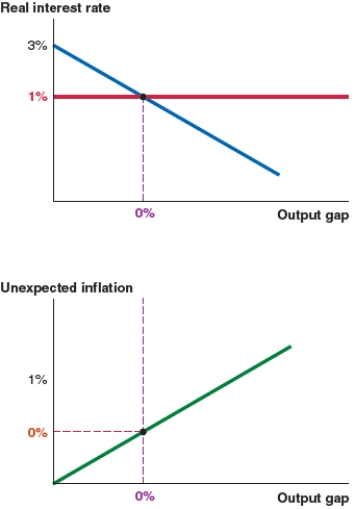
Figure B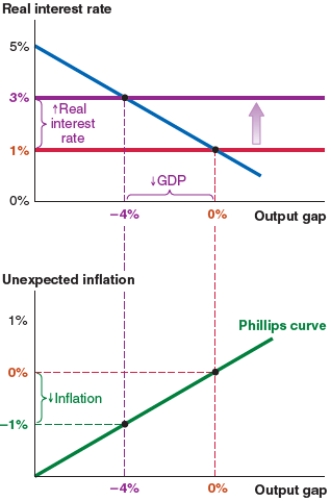
Figure C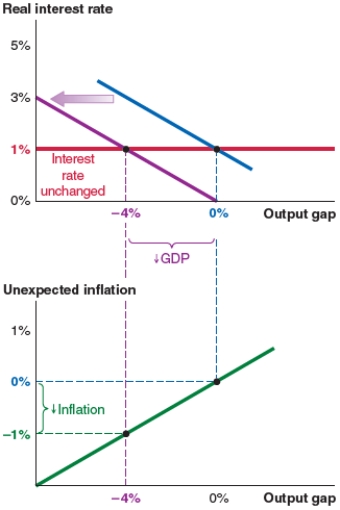
Figure D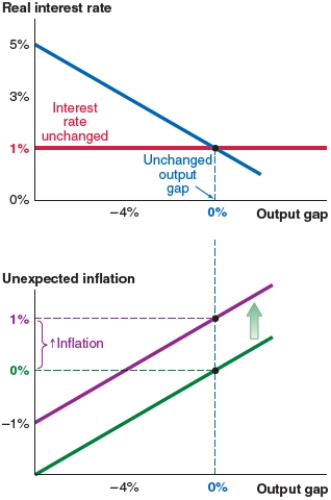
A) Figure A (no change)
B) Figure B (an upward shift of the MP curve and a new interest rate of 3%)
C) Figure C (a leftward shift of the IS curve and an output gap of -4%)
D) Figure D (an upward shift of the Phillips curve and 1% unexpected inflation)
Correct Answer:
Verified
Q66: Which of the following graphs correctly represents
Q67: Which of the following graphs correctly represents
Q68: Which of the following graphs correctly represents
Q69: In 2017, nearly 7.6% of Vietnamese imports
Q70: In 2017, nearly 3.5% of Vietnamese imports
Q72: The economy shown here begins at a
Q73: The economy shown here begins at a
Q74: The economy shown here begins at a
Q75: The economy shown here begins at a
Q76: You are an economic adviser using the
Unlock this Answer For Free Now!
View this answer and more for free by performing one of the following actions

Scan the QR code to install the App and get 2 free unlocks

Unlock quizzes for free by uploading documents