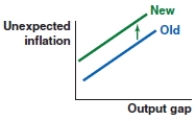
Which figure shows the correct effect on the Phillips curve when there are rising production costs?
A) 
B) 
C) 
D) 
Correct Answer:
Verified
Q79: Suppose the Kenyan markets are experiencing insufficient
Q80: The output gap becomes negative in Bangladesh.
Q81: The output gap becomes more positive in
Q82: Brazil's output rises above potential GDP. Which
Q83: Cameroon's output falls below potential GDP. Which
Q85: Which figure shows the correct effect on
Q86: Which figure shows the correct effect on
Q87: Which figure shows the correct effect on
Q88: Consider the labor market Phillips curve. A
Q89: Consider the labor market Phillips curve. A
Unlock this Answer For Free Now!
View this answer and more for free by performing one of the following actions

Scan the QR code to install the App and get 2 free unlocks

Unlock quizzes for free by uploading documents