Which figure shows the correct effect on the Phillips curve when the domestic currency appreciates?
A) 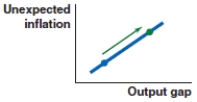
B) 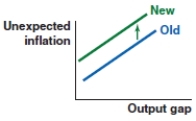
C) 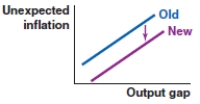
D) 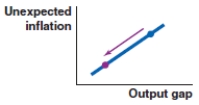
Correct Answer:
Verified
Q82: Brazil's output rises above potential GDP. Which
Q83: Cameroon's output falls below potential GDP. Which
Q84: Which figure shows the correct effect on
Q85: Which figure shows the correct effect on
Q86: Which figure shows the correct effect on
Q88: Consider the labor market Phillips curve. A
Q89: Consider the labor market Phillips curve. A
Q90: An increase in unexpected inflation is seen
Q91: An increase in unemployment is seen graphically
Q92: In the long run, inflation is determined
Unlock this Answer For Free Now!
View this answer and more for free by performing one of the following actions

Scan the QR code to install the App and get 2 free unlocks

Unlock quizzes for free by uploading documents