Which of the following graphs shows the correct effect on the consumption function when consumers become optimistic about the state of the economy?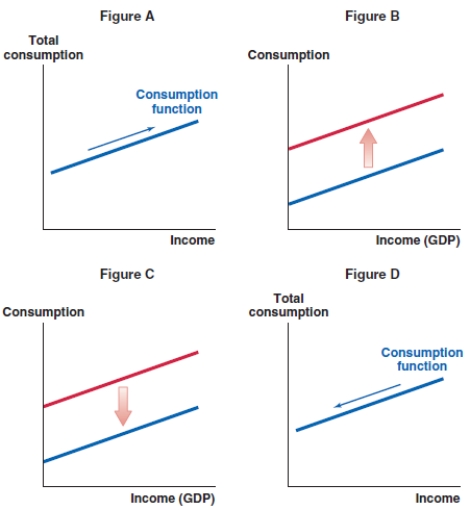
A) Figure A
B) Figure B
C) Figure C
D) Figure D
Correct Answer:
Verified
Q48: Why does a temporary change in income
Q49: Why does an anticipated change in income
Q50: When does an anticipated change in future
Q51: Which of the following graphs shows the
Q52: Which of the following graphs shows the
Q54: Which of the following graphs shows the
Q55: Which of the following graphs shows the
Q56: Which of the following graphs shows the
Q57: Suppose the federal minimum wage decreases in
Q58: Suppose the London stock market experiences a
Unlock this Answer For Free Now!
View this answer and more for free by performing one of the following actions

Scan the QR code to install the App and get 2 free unlocks

Unlock quizzes for free by uploading documents