Suppose the federal minimum wage decreases in the United States. Which of the following graphs shows the correct effect on the consumption function?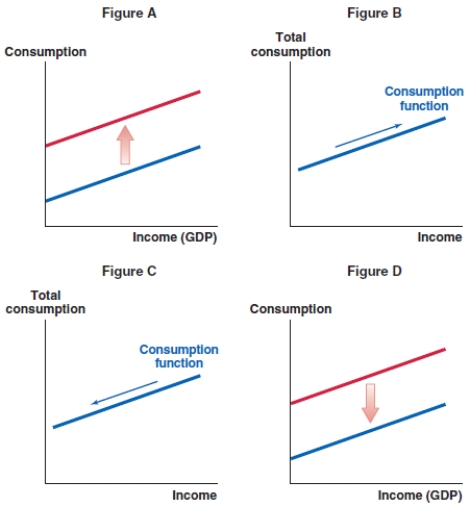
A) Figure A
B) Figure B
C) Figure C
D) Figure D
Correct Answer:
Verified
Q52: Which of the following graphs shows the
Q53: Which of the following graphs shows the
Q54: Which of the following graphs shows the
Q55: Which of the following graphs shows the
Q56: Which of the following graphs shows the
Q58: Suppose the London stock market experiences a
Q59: Suppose the Canadian job markets report is
Q60: What effect does a booming real estate
Q61: If the real estate market in Kyiv,
Q62: Suppose falling interest rates in Australia discourage
Unlock this Answer For Free Now!
View this answer and more for free by performing one of the following actions

Scan the QR code to install the App and get 2 free unlocks

Unlock quizzes for free by uploading documents