(Figure: Market 4) Use the graph to answer the question.
The graph shows the marginal social benefit, demand, and supply curves in the toothbrush market. Market forces would yield a quantity of _____, whereas the socially optimal quantity is _____.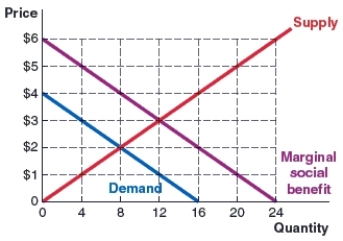
A) four; six
B) eight; 12
C) two; three
D) 12; three
Correct Answer:
Verified
Q78: A market with negative externalities will tend
Q79: The socially optimal amount of an externality
Q80: When the lawn care services market is
Q81: (Figure: Market 4) Use the graph to
Q82: (Figure: Market 4) Use the graph to
Q84: (Figure: Market 5) Use the graph to
Q85: (Figure: Market 5) Use the graph to
Q86: (Figure: Market 5) Use the graph to
Q87: (Market 6) Use the graph to answer
Q88: (Market 6) Use the graph to answer
Unlock this Answer For Free Now!
View this answer and more for free by performing one of the following actions

Scan the QR code to install the App and get 2 free unlocks

Unlock quizzes for free by uploading documents