(Figure: Market 5) Use the graph to answer the question.
The graph shows the marginal social benefit, demand, and supply curves in the toothbrush market. Market forces would yield a quantity of _____, whereas the socially optimal quantity is _____.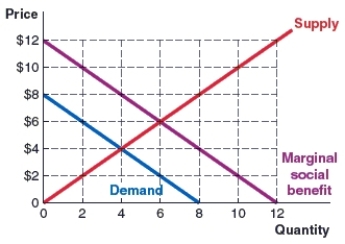
A) four; six
B) eight; four
C) six; four
D) four; eight
Correct Answer:
Verified
Q81: (Figure: Market 4) Use the graph to
Q82: (Figure: Market 4) Use the graph to
Q83: (Figure: Market 4) Use the graph to
Q84: (Figure: Market 5) Use the graph to
Q85: (Figure: Market 5) Use the graph to
Q87: (Market 6) Use the graph to answer
Q88: (Market 6) Use the graph to answer
Q89: (Market 6) Use the graph to answer
Q90: All of the solutions to externality problems
Q91: Which of the following statements describes the
Unlock this Answer For Free Now!
View this answer and more for free by performing one of the following actions

Scan the QR code to install the App and get 2 free unlocks

Unlock quizzes for free by uploading documents