(Figure: Market 4) Use the graph for pounds of grapes to answer the question.
When the actual pounds produced and sold is two, economic surplus in the market is represented by the area between the demand and supply curves: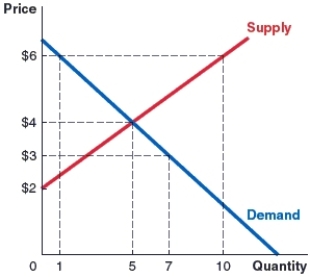
A) to the right of equilibrium.
B) to the left of equilibrium.
C) to the left of the quantity of two.
D) between quantities two and five.
Correct Answer:
Verified
Q107: Which of the following occurs when private
Q108: Irrational decision making in markets results in:
A)consistent
Q109: How does government regulation affect market efficiency?
A)Regulations
Q110: A market's deadweight loss is calculated as:
A)the
Q111: When the economic surplus in a market
Q113: (Figure: Market 4) Use the graph for
Q114: (Figure: Market 5) The graph shows the
Q115: Which of the following is NOT a
Q116: The deadweight loss in an inefficient market
Q117: _ determines the amount of economic surplus;
Unlock this Answer For Free Now!
View this answer and more for free by performing one of the following actions

Scan the QR code to install the App and get 2 free unlocks

Unlock quizzes for free by uploading documents