(Figure: Market 5) The graph shows the market for teddy bears.
When the market produces and sells nine teddy bears, the deadweight loss is represented by the: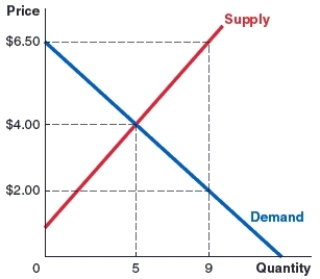
A) rectangle between prices $6.50 and $2 and quantities of zero to 5.
B) rectangle between prices of $6.50 and $2 and quantities of 5 and 9.
C) area between the demand and supply curves to the left of a quantity of 5.
D) area between the demand and supply curves between quantities of 5 and 9.
Correct Answer:
Verified
Q109: How does government regulation affect market efficiency?
A)Regulations
Q110: A market's deadweight loss is calculated as:
A)the
Q111: When the economic surplus in a market
Q112: (Figure: Market 4) Use the graph for
Q113: (Figure: Market 4) Use the graph for
Q115: Which of the following is NOT a
Q116: The deadweight loss in an inefficient market
Q117: _ determines the amount of economic surplus;
Q118: Competitive markets do NOT result in:
A)the largest
Q119: Which of the following is NOT a
Unlock this Answer For Free Now!
View this answer and more for free by performing one of the following actions

Scan the QR code to install the App and get 2 free unlocks

Unlock quizzes for free by uploading documents