(Figure: Demand and Supply of Sugar) Use Figure: Demand and Supply of Sugar. When the supply curve shifts from S1 to S2, the new intersection of supply and demand indicates an equilibrium price of _____ and an equilibrium quantity of 4,000. This supply shift could have resulted from _____. 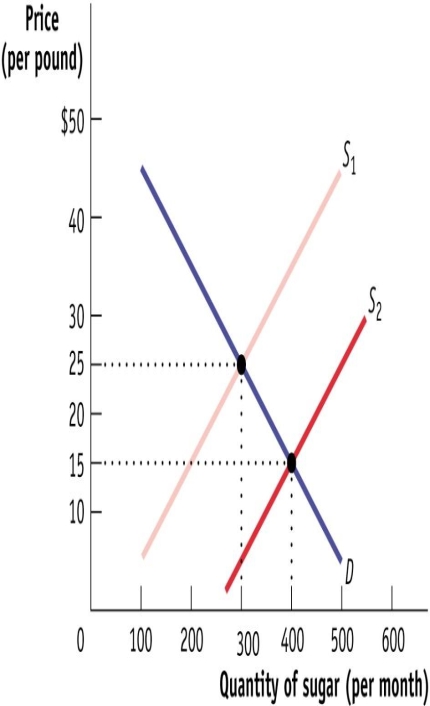
A) $15; an increase in wages
B) $15; an improvement in sugar refining technology
C) $20; an increase in the number of buyers
D) $20; an increase in sugar prices
Correct Answer:
Verified
Q115: The following data shows the yearly
Q116: Canada removes an import tax on certain
Q117: (Figure: Demand and Supply of Sugar) Use
Q118: (Figure: Demand and Supply of Sugar) Use
Q119: (Figure: Demand and Supply of Sugar) Use
Q121: (Figure: Demand and Supply of Sugar) Use
Q122: (Table: The Market for Salt and
Q123: (Table: The Market for Salt and
Q124: (Table: The Market for Salt and
Q125: (Table: The Market for Salt and
Unlock this Answer For Free Now!
View this answer and more for free by performing one of the following actions

Scan the QR code to install the App and get 2 free unlocks

Unlock quizzes for free by uploading documents