(Figure: Demand and Supply of Sugar) Use Figure: Demand and Supply of Sugar. What might cause the supply curve to shift from S2 back to the initial supply curve S1? 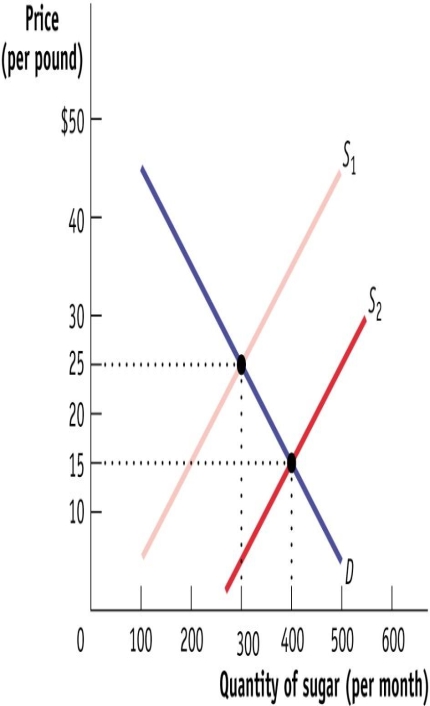
A) restrictions on sugar cane exports by Brazil
B) increased sugar cane production in China
C) a desire by U.S. consumers to buy more ethanol-based gasoline (refined sugar is used to produce that product)
D) improved technology in the refinement of sugar
Correct Answer:
Verified
Q116: Canada removes an import tax on certain
Q117: (Figure: Demand and Supply of Sugar) Use
Q118: (Figure: Demand and Supply of Sugar) Use
Q119: (Figure: Demand and Supply of Sugar) Use
Q120: (Figure: Demand and Supply of Sugar) Use
Q122: (Table: The Market for Salt and
Q123: (Table: The Market for Salt and
Q124: (Table: The Market for Salt and
Q125: (Table: The Market for Salt and
Q126: (Table: The Market for Salt and
Unlock this Answer For Free Now!
View this answer and more for free by performing one of the following actions

Scan the QR code to install the App and get 2 free unlocks

Unlock quizzes for free by uploading documents