(Figure: Shifts in Demand and Supply) Use Figure: Shifts in Demand and Supply. The graph shows how supply and demand might shift in response to specific events. Suppose a new machine allows restaurants and fast-food outlets to produce hamburgers at a lower cost. Which panel BEST illustrates how this innovation will affect the market for hamburgers? 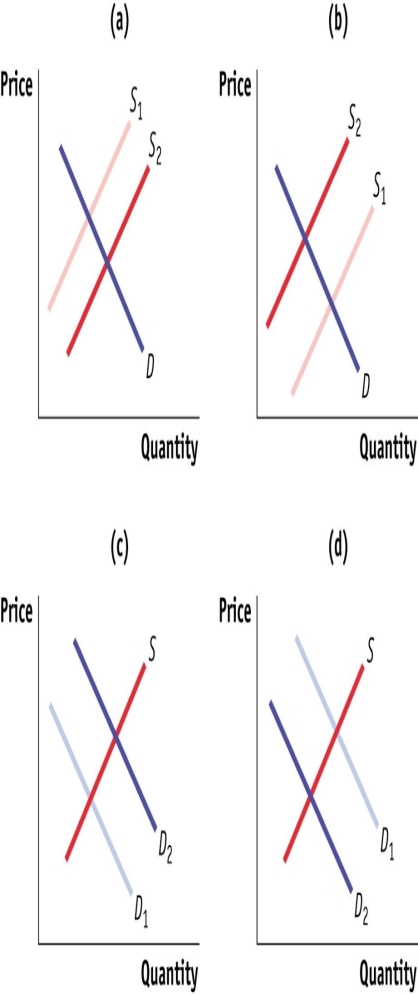
A) A
B) B
C) C
D) D
Correct Answer:
Verified
Q142: If the supply and demand curves intersect
Q143: (Figure: Shifts in Demand and Supply) Use
Q144: (Figure: Shifts in Demand and Supply) Use
Q145: (Figure: Shifts in Demand and Supply) Use
Q146: (Figure: Shifts in Demand and Supply) Use
Q148: (Figure: Shifts in Demand and Supply II)
Q149: (Figure: Shifts in Demand and Supply II)
Q150: (Figure: Shifts in Demand and Supply II)
Q151: (Figure: Shifts in Demand and Supply II)
Q152: (Figure: Shifts in Demand and Supply III)
Unlock this Answer For Free Now!
View this answer and more for free by performing one of the following actions

Scan the QR code to install the App and get 2 free unlocks

Unlock quizzes for free by uploading documents