(Figure: Shifts in Demand and Supply III) Use Figure: Shifts in Demand and Supply III. The figure shows how supply and demand might shift in response to specific events. Suppose a wet and sunny year increases the nation's strawberry crop by 20%. Which panel BEST illustrates how this event will affect the market for strawberries? 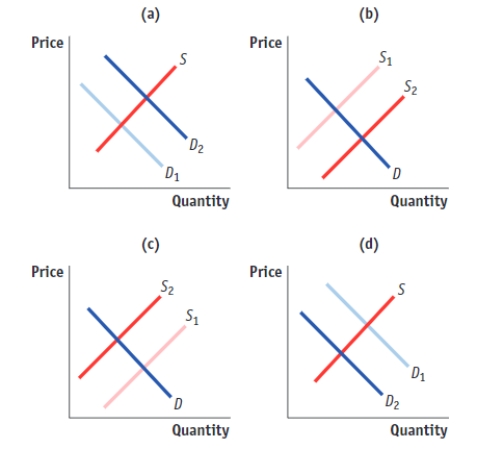
A) A
B) B
C) C
D) D
Correct Answer:
Verified
Q147: (Figure: Shifts in Demand and Supply) Use
Q148: (Figure: Shifts in Demand and Supply II)
Q149: (Figure: Shifts in Demand and Supply II)
Q150: (Figure: Shifts in Demand and Supply II)
Q151: (Figure: Shifts in Demand and Supply II)
Q153: (Figure: Shifts in Demand and Supply III)
Q154: (Figure: Shifts in Demand and Supply III)
Q155: (Figure: Shifts in Demand and Supply IV)
Q156: (Figure: Shifts in Demand and Supply IV)
Q157: (Figure: Shifts in Demand and Supply IV)
Unlock this Answer For Free Now!
View this answer and more for free by performing one of the following actions

Scan the QR code to install the App and get 2 free unlocks

Unlock quizzes for free by uploading documents