(Figure: Graph) In the graph, the movement from point M to point G represents 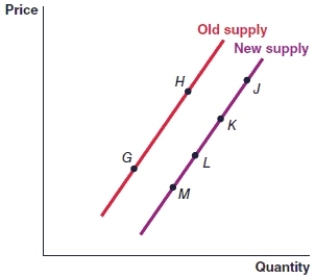
A) a decrease in supply.
B) a decrease in quantity supplied.
C) an increase in quantity supplied.
D) an increase in supply.
Correct Answer:
Verified
Q42: As a part of a market
Q43: As a part of a market
Q44: (Figure: Graph) In the graph, the movement
Q45: (Figure: Graph) In the graph, the movement
Q46: (Figure: Graph) In the graph, the movement
Q48: (Figure: Graph) In the graph, the movement
Q49: (Figure: Graph) In the graph, the movement
Q50: (Figure: Graph) In the graph, an increase
Q51: (Figure: Graph) In the graph, a decrease
Q52: (Figure: Market for Coffee) A coffee shop
Unlock this Answer For Free Now!
View this answer and more for free by performing one of the following actions

Scan the QR code to install the App and get 2 free unlocks

Unlock quizzes for free by uploading documents