(Figure: Graph) In the graph, the movement from point L to point K is caused by 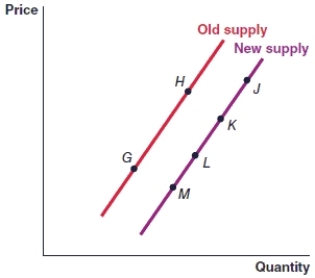
A) an increase in the price of the item.
B) a decrease in the price of the item.
C) a decrease in the supply of the item.
D) an increase in the supply of the item.
Correct Answer:
Verified
Q44: (Figure: Graph) In the graph, the movement
Q45: (Figure: Graph) In the graph, the movement
Q46: (Figure: Graph) In the graph, the movement
Q47: (Figure: Graph) In the graph, the movement
Q48: (Figure: Graph) In the graph, the movement
Q50: (Figure: Graph) In the graph, an increase
Q51: (Figure: Graph) In the graph, a decrease
Q52: (Figure: Market for Coffee) A coffee shop
Q53: (Figure: Change in Supply) There are four
Q54: Which of the following is NOT a
Unlock this Answer For Free Now!
View this answer and more for free by performing one of the following actions

Scan the QR code to install the App and get 2 free unlocks

Unlock quizzes for free by uploading documents