(Figure: Demand for Bus Rides) The city of Vaughan in Ontario, Canada, opened a new subway line that extended the existing subway system between the greater Toronto area and the city of Vaughan. The route previously only had bus service. Which of the following graphs depicts the effect you would expect to see on the demand for bus rides on this route after the introduction of the subway?
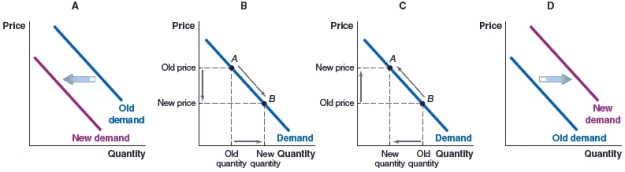
A) Graph A
B) Graph B
C) Graph C
D) Graph D
Correct Answer:
Verified
Q47: Fast food is a good example of
A)a
Q48: Holding all else constant, if people eat
Q49: Recent evidence suggests exercise promotes longevity and
Q50: In March 2019, airlines around the world
Q51: (Figure: Leather Wallets) Fossil has started an
Q53: (Figure: Peanut Butter and Jelly) In the
Q54: (Figure: Butter and Jam) Some people like
Q55: (Figure: Demand for Rental Housing) Fort Collins,
Q56: (Figure: Market for Luxury Vehicles) Which graph
Q57: (Figure: Market for Holiday Cruises) Which graph
Unlock this Answer For Free Now!
View this answer and more for free by performing one of the following actions

Scan the QR code to install the App and get 2 free unlocks

Unlock quizzes for free by uploading documents