(Figure: Market for Holiday Cruises) Which graph shows the effect of an impending slowdown on the market for cruise holidays?
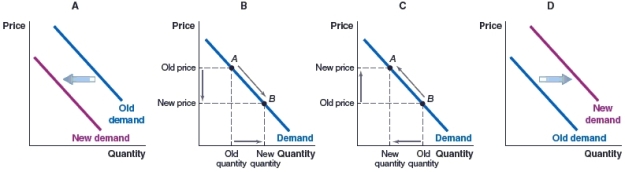
A) Graph A
B) Graph B
C) Graph C
D) Graph D
Correct Answer:
Verified
Q52: (Figure: Demand for Bus Rides) The city
Q53: (Figure: Peanut Butter and Jelly) In the
Q54: (Figure: Butter and Jam) Some people like
Q55: (Figure: Demand for Rental Housing) Fort Collins,
Q56: (Figure: Market for Luxury Vehicles) Which graph
Q58: (Figure: Market for High-End Meals) What will
Q59: (Figure: Market for Community College) Which graph
Q60: (Figure: Market for New Housing) Which of
Q61: (Figure: Market for New Housing) Which graph
Q62: (Figure: Market for Printing Paper) Which of
Unlock this Answer For Free Now!
View this answer and more for free by performing one of the following actions

Scan the QR code to install the App and get 2 free unlocks

Unlock quizzes for free by uploading documents