(Figure: Market for New Housing) Which graph shows the effect on the housing market today, if the realtor association predicts new housing prices to rise in a few months?
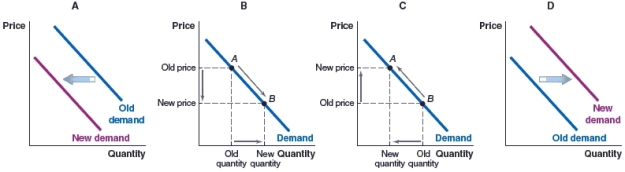
A) Graph A
B) Graph B
C) Graph C
D) Graph D
Correct Answer:
Verified
Q56: (Figure: Market for Luxury Vehicles) Which graph
Q57: (Figure: Market for Holiday Cruises) Which graph
Q58: (Figure: Market for High-End Meals) What will
Q59: (Figure: Market for Community College) Which graph
Q60: (Figure: Market for New Housing) Which of
Q62: (Figure: Market for Printing Paper) Which of
Q63: (Figure: Market for Roses) Which graph illustrates
Q64: If Tesla cars become less expensive, what
Q65: (Figure: Market for Stevia) Stevia is a
Q66: (Figure: Market for Bread) Bread and cheese
Unlock this Answer For Free Now!
View this answer and more for free by performing one of the following actions

Scan the QR code to install the App and get 2 free unlocks

Unlock quizzes for free by uploading documents