In the graph below, all preintervention observations are less favorable than the post interventions observations; 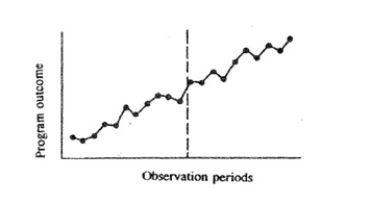
A) clearly the intervention had an impact.
B) regression to the mean is the most likely reason for the change.
C) the possible effects of maturation or history should be considered carefully.
D) partial correlations should be calculated before drawing any conclusions.
Correct Answer:
Verified
Q1: To show that a program had an
Q2: The ways in which evaluators expand on
Q3: The primary reason to increase the number
Q4: A time series evaluation design leads to
A)
Q6: A pattern like the one in the
Q7: A particularly strong time series design is
Q8: Smoothing a graph of observations made over
Q9: When a group similar to the program
Q10: The major weakness of the nonequivalent, control
Q11: If the program participants in a non-equivalent
Unlock this Answer For Free Now!
View this answer and more for free by performing one of the following actions

Scan the QR code to install the App and get 2 free unlocks

Unlock quizzes for free by uploading documents