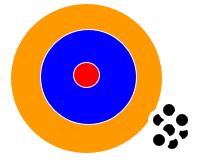
The illustration below represents.
A) Validity
B) Reliability
C) Heterogeneity
D) Experimenter bias
Correct Answer:
Verified
Q1: The following is NOT an example of
Q3: The following is an example of
Q4: A scale that has "strongly agree" and
Q5: Researchers often use Likert scales with _
Q6: _ is used as a test of
Q7: A typical and widely cited benchmark for
Q8: Researchers often use fixed sum scale with
Q9: When responding to a Likert questionnaire item,
Q10: Typically values for Cronbach's ? range from
Q11: Negative values for Cronbach's alpha are technically
Unlock this Answer For Free Now!
View this answer and more for free by performing one of the following actions

Scan the QR code to install the App and get 2 free unlocks

Unlock quizzes for free by uploading documents