Solved

Dependent Variable: WHY
Method: Least Squares
Sample(adjusted): 19652006
Included Observations

Question 1

Essay

Dependent Variable: WHY
Method: Least Squares
Sample(adjusted): 19652006
Included observations: 30 atter adjusting endpoints

 Variable  Coefficient  Std. Error  t-Statistic  Prob.  C 19.60486123.50640.1587360.8747 EX1 20.0411212.569871.5943770.1189 EX2 0.5171400.00773866.835400.0000 R-squared 0.991948 Mean dependent var 2775.633 Adjusted R-squared 0.991536 S.D. dependent var 1915.813 S.E. of regression 176.2591 Akaike info criterion 13.25054 Sum squared resid 1211624. Schwarz criterion 13.37466 Log likelihood 275.2613 F-statistic 2402.403 Durbin-Watson stat 0.289425 Prob(F-statistic) 0.000000\begin{array}{lllll}\hline \text { Variable } & \text { Coefficient } & \text { Std. Error } & \text { t-Statistic } & \text { Prob. } \\\hline \hline \text { C } & -19.60486 & 123.5064 & -0.158736 & 0.8747 \\\text { EX1 } & 20.04112 & 12.56987 & 1.594377 & 0.1189 \\\text { EX2 } & 0.517140 & 0.007738 & 66.83540 & 0.0000 \\\hline \text { R-squared } & 0.991948 &\text { Mean dependent var } && 2775.633 \\\text { Adjusted R-squared } & 0.991536 & \text { S.D. dependent var } && 1915.813 \\\text { S.E. of regression } & 176.2591 & \text { Akaike info criterion }&& 13.25054 \\\text { Sum squared resid } & 1211624 . & \text { Schwarz criterion } && 13.37466 \\\text { Log likelihood } & -275.2613 & \text { F-statistic }&& 2402.403 \\\text { Durbin-Watson stat } & 0.289425 &\text { Prob(F-statistic) } && 0.000000\end{array} Use the Eviews output above to help with A) through I) below.
A) Interpret the coefficient on EX1.
B) Interpret R2 for this regression.
C) Replace the "?"'s with the appropriate values. An 80% confidence interval around the coefficient on EX1 is: 20.04112 +/- (?)(?)
D) Perform a positive sign test on the coefficient attached to EX2. Show the 5-step procedure.
E) IF you performed a test of significance on the constant term at the 87 percent critical level, would you reject the null hypothesis or not? Explain.
F) Perform a test to determine if the coefficient attached to EX2 is greater than 7.47. Show the 5-step procedure.
G) Based on the information in the table above (and ignoring Ramsey's Reset test which we will perform in a moment) do you think the regression above is under or over specified? Explain.
H)1.Perform Ramsey's Reset Test on the regression above using the Eviews printout below. Show the 5-step procedure.  Dependent Variable: WHY Method: Least Squares Sample(adjusted): 19652006 Included observations: 30 atter adjusting endpoints   \begin{array}{lllll} \hline \text { Variable } & \text { Coefficient } & \text { Std. Error } & \text { t-Statistic } & \text { Prob. } \\ \hline \hline \text { C } & -19.60486 & 123.5064 & -0.158736 & 0.8747 \\ \text { EX1 } & 20.04112 & 12.56987 & 1.594377 & 0.1189 \\ \text { EX2 } & 0.517140 & 0.007738 & 66.83540 & 0.0000 \\ \hline \text { R-squared } & 0.991948 &\text { Mean dependent var } && 2775.633 \\ \text { Adjusted R-squared } & 0.991536 & \text { S.D. dependent var } && 1915.813 \\ \text { S.E. of regression } & 176.2591 & \text { Akaike info criterion }&& 13.25054 \\ \text { Sum squared resid } & 1211624 . & \text { Schwarz criterion } && 13.37466 \\ \text { Log likelihood } & -275.2613 & \text { F-statistic }&& 2402.403 \\ \text { Durbin-Watson stat } & 0.289425 &\text { Prob(F-statistic) } && 0.000000 \end{array}  Use the Eviews output above to help with A) through I) below.  A) Interpret the coefficient on EX1. B) Interpret R<sup>2</sup> for this regression. C) Replace the  ? 's with the appropriate values. An 80% confidence interval around the coefficient on EX1 is: 20.04112 +/- (?)(?) D) Perform a positive sign test on the coefficient attached to EX2. Show the 5-step procedure. E) IF you performed a test of significance on the constant term at the 87 percent critical level, would you reject the null hypothesis or not? Explain. F) Perform a test to determine if the coefficient attached to EX2 is greater than 7.47. Show the 5-step procedure. G) Based on the information in the table above (and ignoring Ramsey's Reset test which we will perform in a moment) do you think the regression above is under or over specified? Explain. H)1.Perform Ramsey's Reset Test on the regression above using the Eviews printout below. Show the 5-step procedure.    2. What is the difference between  FITTED^2  and  FITTED^3  in the Eviews printout above? Do the two terms appear in the restricted or unrestricted regression?
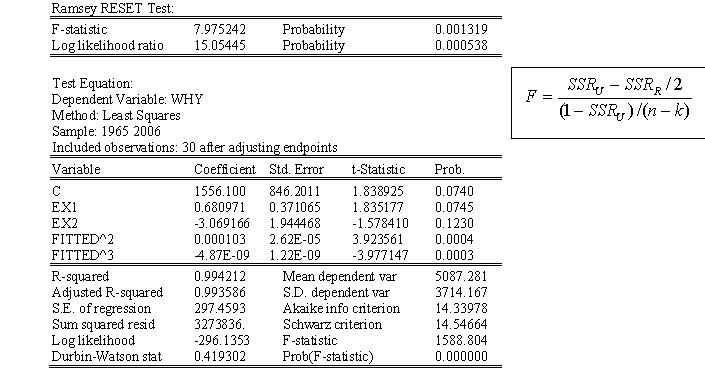
2. What is the difference between "FITTED^2" and "FITTED^3" in the Eviews printout above? Do the two terms appear in the restricted or unrestricted regression?

Correct Answer:

verifed

Verified

Related Questions

Unlock this Answer For Free Now!

View this answer and more for free by performing one of the following actions

qr-code

Scan the QR code to install the App and get 2 free unlocks

upload documents

Unlock quizzes for free by uploading documents