The following graph represents the total production of a firm on the y-axis, and the number of employees on the x-axis.
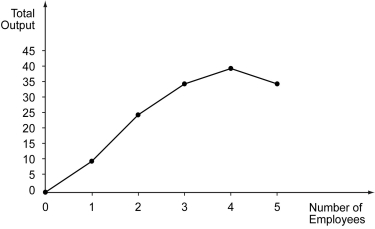
-Refer to the figure above.Diminishing marginal returns begin to occur when ________.
A) the second worker is hired
B) the third worker is hired
C) the fourth worker is hired
D) the fifth worker is hired
Correct Answer:
Verified
Q71: The following table shows the total output,
Q72: The following figure depicts the marginal cost
Q73: The following table shows the total output,
Q74: Marginal cost is the _.
A) cost(s) a
Q75: The following table shows the total output,
Q77: Define the terms "production" and "production function."
Q78: The following graph represents the total production
Q79: Is it possible for an input to
Q80: The following table shows the total output,
Q81: The following table shows the total output,
Unlock this Answer For Free Now!
View this answer and more for free by performing one of the following actions

Scan the QR code to install the App and get 2 free unlocks

Unlock quizzes for free by uploading documents