The following figure depicts the marginal cost curve, the average total curve, and the average variable cost curve of a certain firm.
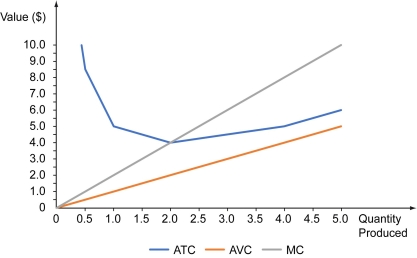
-Refer to the figure above.What is the price on the market when the firm makes a profit of $4,50?
A) $4
B) $5
C) $6
D) $8
Correct Answer:
Verified
Q67: Which of the following is the difference
Q68: The following table shows the total output,
Q69: The total cost of production refers to
Q70: The following table shows the total output,
Q71: The following table shows the total output,
Q73: The following table shows the total output,
Q74: Marginal cost is the _.
A) cost(s) a
Q75: The following table shows the total output,
Q76: The following graph represents the total production
Q77: Define the terms "production" and "production function."
Unlock this Answer For Free Now!
View this answer and more for free by performing one of the following actions

Scan the QR code to install the App and get 2 free unlocks

Unlock quizzes for free by uploading documents