The figure below shows the cost curves of a firm in a competitive market. The firm always makes the choice to maximize its profit.
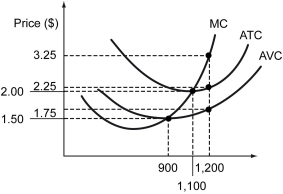
-Refer to the figure above.If the market price of the product is $2.00,the firm's profit maximizing output is ________ and its maximum profit is ________.
A) 900 units; -$600
B) 900 units; -$300
C) 1,100 units; $0.00
D) 1,100 units; $300
Correct Answer:
Verified
Q132: The figure below shows the cost curves
Q133: The figure below shows cost curves of
Q134: The supply curve of good A,and the
Q135: The figure below shows the cost curves
Q136: Assume that the market demand for pens
Q138: Given the following price,quantity,and cost numbers,estimate the
Q139: The figure below shows cost curves of
Q140: If the price elasticity of supply of
Q141: Calculate the price elasticity of supply for
Q142: If a firm is maximizing profits in
Unlock this Answer For Free Now!
View this answer and more for free by performing one of the following actions

Scan the QR code to install the App and get 2 free unlocks

Unlock quizzes for free by uploading documents