The figure below shows the cost curves of a firm in a competitive market. The firm always makes the choice to maximize its profit.
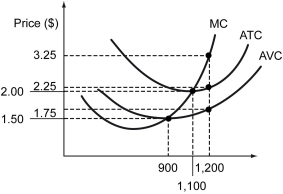
-Refer to the figure above.The short-run supply curve of the firm is ________.
A) vertical at 0 units between the price $0 and $2.25, then it follows the marginal cost curve
B) vertical at 0 units between the price $0 and $1.50, then it follow the marginal cost curve
C) the upward-sloping portion of the marginal cost curve only
D) the downward-sloping portion of the average variable cost until it crosses the marginal cost curve, then it follows the marginal cost curve
Correct Answer:
Verified
Q127: The price elasticity of supply is the
Q128: Which of the following is true of
Q129: The figure below shows the cost curves
Q130: Which of the following is true?
A) Accounting
Q131: Differentiate between the terms "revenue" and "profit."
Q133: The figure below shows cost curves of
Q134: The supply curve of good A,and the
Q135: The figure below shows the cost curves
Q136: Assume that the market demand for pens
Q137: The figure below shows the cost curves
Unlock this Answer For Free Now!
View this answer and more for free by performing one of the following actions

Scan the QR code to install the App and get 2 free unlocks

Unlock quizzes for free by uploading documents