The figure below shows short-run average total cost curves for a firm under four different production technologies. Assume that there are only four different technologies that the firm could use.
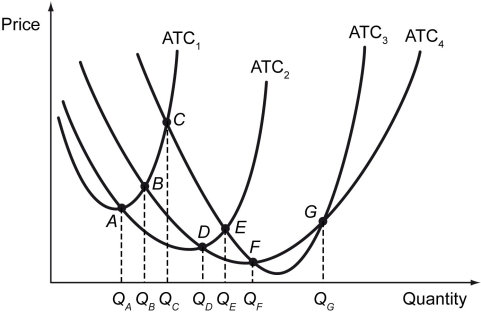
-Refer to the figure above.Between the output quantity QA and QC,the long-run average total cost curve of the firm exhibits ________.
A) economies of scale
B) constant returns to scale
C) diseconomies of scale
D) diminishing marginal product
Correct Answer:
Verified
Q200: The following figure depicts the supply curve
Q201: Which of the following is true for
Q202: The figure below shows short-run average total
Q203: The figure below shows short-run average total
Q204: Scenario: Emily runs a small coffee roasting
Q206: The following figure depicts a firm's long-run
Q207: _ occur when average total cost falls
Q208: If the market for bottled water is
Q209: Scenario: Emily runs a small coffee roasting
Q210: In a perfectly competitive market,firms earn zero
Unlock this Answer For Free Now!
View this answer and more for free by performing one of the following actions

Scan the QR code to install the App and get 2 free unlocks

Unlock quizzes for free by uploading documents