The following figure depicts a firm's long-run average total cost and selected short-run average total cost curves.
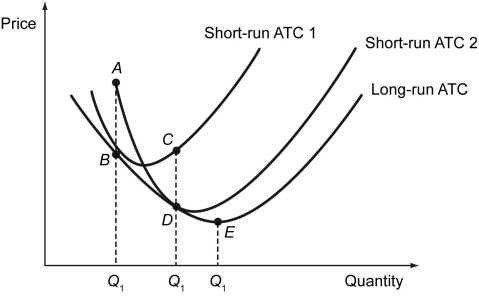
-Refer to the figure above.If this firm is producing at point B,we could say that it ________.
A) is maximizing profits
B) is minimizing the cost of producing Q₁
C) can lower its costs by moving to point A
D) would minimize total costs by moving to point E
Correct Answer:
Verified
Q201: Which of the following is true for
Q202: The figure below shows short-run average total
Q203: The figure below shows short-run average total
Q204: Scenario: Emily runs a small coffee roasting
Q205: The figure below shows short-run average total
Q207: _ occur when average total cost falls
Q208: If the market for bottled water is
Q209: Scenario: Emily runs a small coffee roasting
Q210: In a perfectly competitive market,firms earn zero
Q211: In the long run,a firm should exit
Unlock this Answer For Free Now!
View this answer and more for free by performing one of the following actions

Scan the QR code to install the App and get 2 free unlocks

Unlock quizzes for free by uploading documents