The following figure depicts a firm's long-run average total cost and selected short-run average total cost curves.
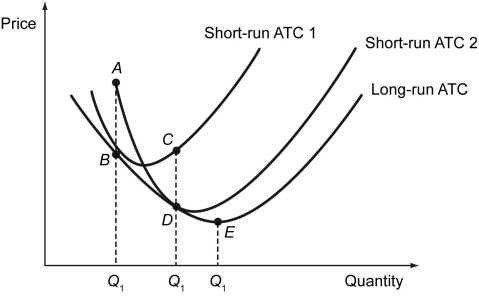
-Refer to the figure above.The firm is currently producing at point B.An increase in its capital may be represented by ________.
A) a movement to A
B) a movement to C
C) a movement to D
D) a movement to E
Correct Answer:
Verified
Q232: Which of the following is true of
Q233: A firm is interested in entering a
Q234: The following figure depicts a firm's long-run
Q235: Which of the following statements is true?
A)
Q236: The following figure shows the cost curves
Q238: The following figure shows the cost curves
Q239: In a perfectly competitive market,the long-run market
Q240: The following figure depicts a firm's long-run
Q241: Scenario: The figure below shows the supply
Q242: Scenario: The figure below shows the supply
Unlock this Answer For Free Now!
View this answer and more for free by performing one of the following actions

Scan the QR code to install the App and get 2 free unlocks

Unlock quizzes for free by uploading documents