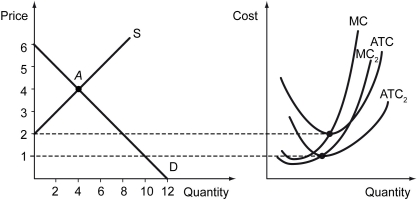
Scenario: The figure below shows the supply and the demand for a good (left) and the cost curves of an individual firm in this market (right) . Initially, all firms in this market have identical cost curves MC₁ and ATC₁, and the market is in equilibrium at point A. Subsequently, a new production technology has been developed for this product. Some of the existing firms as well as some new firms have adopted the new technology, and their cost curves are MC₂ and ATC₂.
-Refer to the figure above.At A,the market is ________.
A) in the long-run equilibrium, and each firm in the market earns zero economic profit
B) in the long-run equilibrium, and each firm in the market earns positive economic profit
C) in the short-run equilibrium, and each firm in the market earns zero economic profit
D) in the short-run equilibrium, and each firm in the market earns positive economic profit
Correct Answer:
Verified
Q237: The following figure depicts a firm's long-run
Q238: The following figure shows the cost curves
Q239: In a perfectly competitive market,the long-run market
Q240: The following figure depicts a firm's long-run
Q241: Scenario: The figure below shows the supply
Q243: Is it true that in the long
Q244: Why is the profitability of firms under
Q245: In a perfectly competitive market,a marginal entrant
Q246: In a competitive industry,some firms earn positive
Q247: Suppose ethanol is produced in a perfectly
Unlock this Answer For Free Now!
View this answer and more for free by performing one of the following actions

Scan the QR code to install the App and get 2 free unlocks

Unlock quizzes for free by uploading documents