The following graph represents the market for a certain good.
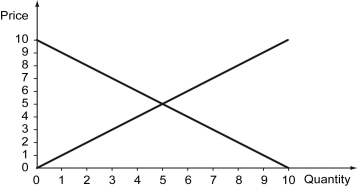
-Refer to the graph above.Which two outcomes create the same social surplus?
A) (Price = 5 and Quantity = 5) and (Price = 5 and Quantity = 6)
B) (Price = 4 and Quantity = 4) and (Price = 4 and Quantity = 7)
C) (Price = 4 and Quantity = 5) and (Price = 5 and Quantity = 4)
D) (Price = 5 and Quantity = 4) and (Price = 5 and Quantity = 6)
Correct Answer:
Verified
Q64: The following figure shows the marginal cost
Q65: The following figure shows the marginal cost
Q66: $100 is to be divided among two
Q67: Efficiency in competitive markets is characterized by
Q68: The following graph represents the market for
Q70: Define a Pareto efficient outcome.Does it ensure
Q71: The concept of the invisible hand suggests
Q72: The following graph shows the marginal cost
Q73: An outcome is Pareto efficient if _.
A)
Q74: The tables below show reservation values of
Unlock this Answer For Free Now!
View this answer and more for free by performing one of the following actions

Scan the QR code to install the App and get 2 free unlocks

Unlock quizzes for free by uploading documents