The following graph shows the marginal cost curves of two profit-maximizing firms in a perfectly competitive market.
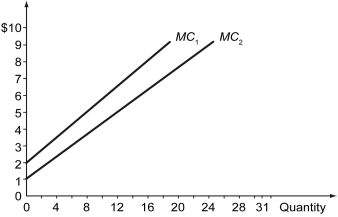
-Refer to the graph above.If the equilibrium price in this market is $5,Firm 1's producer surplus is equal ________,and Firm 2's producer surplus is equal ________.
A) $24; $16
B) $24; $40
C) $12; $24
D) $14; $8
Correct Answer:
Verified
Q67: Efficiency in competitive markets is characterized by
Q68: The following graph represents the market for
Q69: The following graph represents the market for
Q70: Define a Pareto efficient outcome.Does it ensure
Q71: The concept of the invisible hand suggests
Q73: An outcome is Pareto efficient if _.
A)
Q74: The tables below show reservation values of
Q75: When an outcome is Pareto efficient,_.
A) social
Q76: Which of the following statements is true
Q77: $20 is to be divided among two
Unlock this Answer For Free Now!
View this answer and more for free by performing one of the following actions

Scan the QR code to install the App and get 2 free unlocks

Unlock quizzes for free by uploading documents