The following figure depicts the short-run cost curves of a perfectly competitive firm.
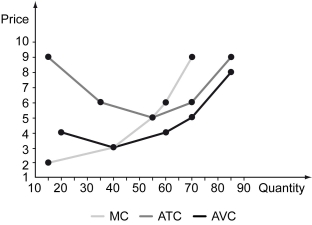
-Refer to the figure above.A firm could choose to produce a quantity of 60 in the long run if ________.
A) this firm could not exit the industry
B) the firm was experiencing decreasing returns to scale
C) barriers to entry existed
D) the firm expected to price to rise in the future
Correct Answer:
Verified
Q114: The following figure depicts the short-run cost
Q115: Scenario: A manufacturing firm operates three plants
Q116: The following figure depicts the short-run cost
Q117: Positive economic profits in a perfectly competitive
Q118: The following figure illustrates the marginal cost
Q120: Scenario: A manufacturing firm operates three plants
Q121: The following figure represents the cost curves
Q122: The incentive for new firms to enter
Q123: When sellers in a perfectly competitive market
Q124: The entry of new firms into a
Unlock this Answer For Free Now!
View this answer and more for free by performing one of the following actions

Scan the QR code to install the App and get 2 free unlocks

Unlock quizzes for free by uploading documents