The following figure represents the cost curves of two firms operating in different perfectly competitive industries. This economy consists only of industries 1 and 2.
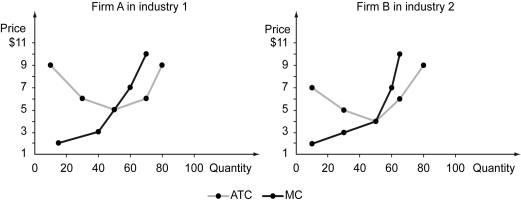
-Refer to the figure above.If the market price in industry 1 is $7 and the market price in industry 2 is $3,we should expect ________ in the long run.
A) firm A to exit industry 1 and enter industry 2
B) both fims to stay in their respective industries
C) firm B to exit industry 2 and not enter industry 1
D) firm B to exit industry 2 and enter industry 1
Correct Answer:
Verified
Q116: The following figure depicts the short-run cost
Q117: Positive economic profits in a perfectly competitive
Q118: The following figure illustrates the marginal cost
Q119: The following figure depicts the short-run cost
Q120: Scenario: A manufacturing firm operates three plants
Q122: The incentive for new firms to enter
Q123: When sellers in a perfectly competitive market
Q124: The entry of new firms into a
Q125: In a perfectly competitive market,if market price
Q126: If firms in a perfectly competitive industry
Unlock this Answer For Free Now!
View this answer and more for free by performing one of the following actions

Scan the QR code to install the App and get 2 free unlocks

Unlock quizzes for free by uploading documents