The following figure shows the demand and supply curves for a good. The initial demand curve is D₁ and the supply curve is S. Later, due to an external shock, the demand curve shifts to D₂.
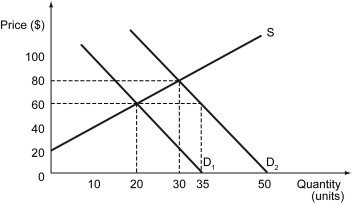
-Refer to the figure above.What is the initial equilibrium quantity of the good?
A) 20 units
B) 30 units
C) 35 units
D) 50 units
Correct Answer:
Verified
Q157: Without any restrictions in a perfectly competitive
Q158: Scenario: The rare earth element neodymium is
Q159: If a new production process is developed
Q160: Scenario: The rare earth element neodymium is
Q161: The following figure illustrates the demand and
Q163: The following figure illustrates the demand and
Q164: The following figure illustrates the demand and
Q165: Scenario: The retail market for beef in
Q166: A price control is _.
A) a market-determined
Q167: Which of the following statements differentiates between
Unlock this Answer For Free Now!
View this answer and more for free by performing one of the following actions

Scan the QR code to install the App and get 2 free unlocks

Unlock quizzes for free by uploading documents